| Contents | Previous Chapter | Next Chapter |
If n sets are connected by a function (operation) with each other, then this function is applied to all possible n-tuples of the individual elements, the function arguments.
Explanation of the notation:
May a Boolean function f connect two operands an and b:
The Boolean function f(a,b) is then applied to the element pair (2-tuples)
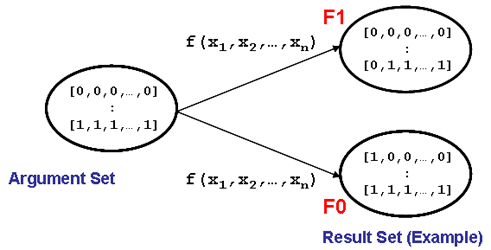
The result this operation f(a,b) can again be described by sets, the result sets. Since for the resulting values of the Boolean function f only the values 0 and 1 are possible, the result can be presented using the 0-set and 1-set::
For an n-ary Boolean function the result can be described in a corresponding form. The Boolean function f(a0,a1,...,an) assigns a function value "0" or "1" to each of the arguments (n-tuples), it "sorts" the n-tuples in the sets F0 or F1:
The Boolean function maps the argument-set to the set of function values.
These conditions can be illustrated in graphical form:

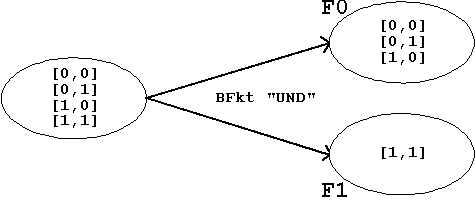
Example: The binary Boolean Function "AND"
Definition:
The Boolean function "AND" delivers the result "1" only when all function arguments have the value "1".
This leads to the following result-sets::
which in turn can again be represented graphically:

Figure 1.4: The Boolean Function "AND"
There are other options to characterize a Boolean functions.
Frequently used is a description using tables, known as "function tables". Other synonymous names in common use are "value table", "truth table" or similar ones.
Example: Truth table of the function "AND":
Another form of description defines the Boolean function using a mathematical symbol or operator (similar to the way basic arithmetic operations use symbols like+, -, etc.). In some cases as in the case of the function "AND" several symbols are available, that are equivalent in their meaning.
Example: mathematical symbol (operator) for the function"AND":
Expressions like "Digital Circuit", "Switching Technology", etc. indicate that electromechanical switches (relays) once played an important role in electronics. Their role is a minor one today, nevertheless switches can be used to clarify the behaviour of Boolean functions.
Example: Switch Implementation of the Function "AND" (see above):

Figure 1.5: "AND"-Function.
This contact model shows, that a serial connection of two switches a and b will activate a subsequent load only in the case that a as well as b are closed. When the closed condition is interpreted as a state "1", then the behaviour corresponds to the Boolean function "AND" as described above using a truth table.
A set-oriented presentation of Boolean functions can be used in another graphical form, known as Venn-Diagram.
In this Venn-Diagram the argument-sets and the result-sets are combined in such a way, that a very simple interpretation is possible. The two sets are characterized using different properties.
Using the example of a simple unary function this process can be shown in detail:
Example: The unary Function "NOT" (NEGATION, INVERSE Function):
This function acts only on one single (unary) parameter, inverting the logical value of the argument, i.e.;
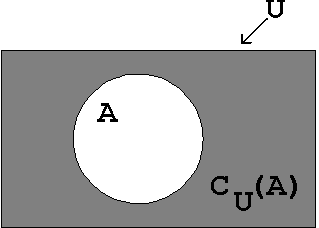
May U be a reference set (universal set), which contains the set A. Then the complement set (or completion set) of A can be defined, which covers all elements that are contained in U but not in A.
CU(A) is the complement-set of A relative to U.
The corresponding Venn-Diagram will look as follows:

Figure 1.6: Venn-Diagram of the INVERSE Function
In order to manipulate larger digital circuits the presentation methods introduced so far can still be used, e.g. the set presentation or the functional description, etc.
But in the development of more complex circuits this easily results in unclear and confusing representations. Therefore a method has proven to be more successful that applies so-called circuit symbols to represent the functions.
These symbols are standardized internationally and allow a unique and complete (logical) description of digital circuits.
Unfortunately we can not talk of just one standard. Because of the historical development different symbol standards exist, which even today are used independently from each other:
Standards 1 and 2 are used in the corresponding countries. Standard 3 is an old DIN-standard that should not be used anymore today.
Example: Circuit Symbols for the Function "NOT"
 |
 |  |
Observation:
Similar circuit symbols exist for Boolean functions of several variables (see below).
The Venn-Diagrams introduced above can be used for a graphical presentation, even when new and more complex Boolean functions are created combining several individual functions.
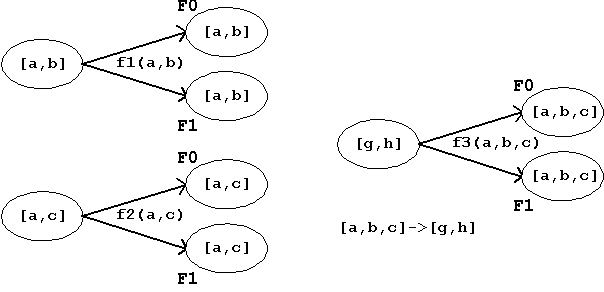
Let f1(a,b) and f2(a,c) be two binary Boolean function, whose arguments a, b, and c receive external values (signals). The results of f1 and f2
shall then serve as input arguments of a third binary function
f3(g,h). That means that the result of f3 will depend on a,b, and c.
Again this situation can be presented graphically, e.g. symbolizing the individual function using boxes:

Figure 1.8:
Combining two Boolean Functions.
In a similar manner all logical operations are defined symbolically in Digital Design (Digital Technology).
The same combination of functions can be illustrated again using sets of arguments and results:

Figure 1.9:
Set Presentation of a Combination of Functions.
In case that Venn-Diagrams should be used again for presentation, it is advisable in this more complex case to present the individual argument elements in a more visible manner (e.g. using points or circles that are distinguishable through different couloirs or shadings). For the above sample function this could look like:

Figure 1.10:
Venn-Diagram to present the Combination of Functions.
Then for the 1-sets F1, F2 and F3 the following applies:
Also:
The function definition shown here is unique for
f1 and f2, but not for f3, what can be verified looking e.g. at function value f3(1,0,0).
| Contents | Previous Chapter | Next Chapter |